Meet the stage on which the progress economy plays out
What we’re thinking
The progress diagram allows us to visually represent the progress economy’s key concepts. What is progress, the progress journey, progress attempts, understanding propositions, enacting innovation (progress levers), sales (progress alignment), and more.
It shows progress over time on the horizontal access and the vertical axis notionally indicates levels of progress (explaining why progress sought is always to the right and higher than progress origin).
Propositions can be similarly drawn on the diagram, although their vertical positioning is not meant to imply any level of progress compared to each other or the Seeker’s progress journey.
Since value it is seen as context specific progress comparisons, it may also be shown on the horizontal axis. Typically the context of emerged value is noted with 0 at the Seeker’s origin and maximum at the Seeker’s progress sought.
Introducing the progress diagram
The progress diagram is the stage on which we can visually explore and explain the key concepts of the Progress Economy, and elicit the progress levers that underpin both innovation and sales.
Navigating the diagram
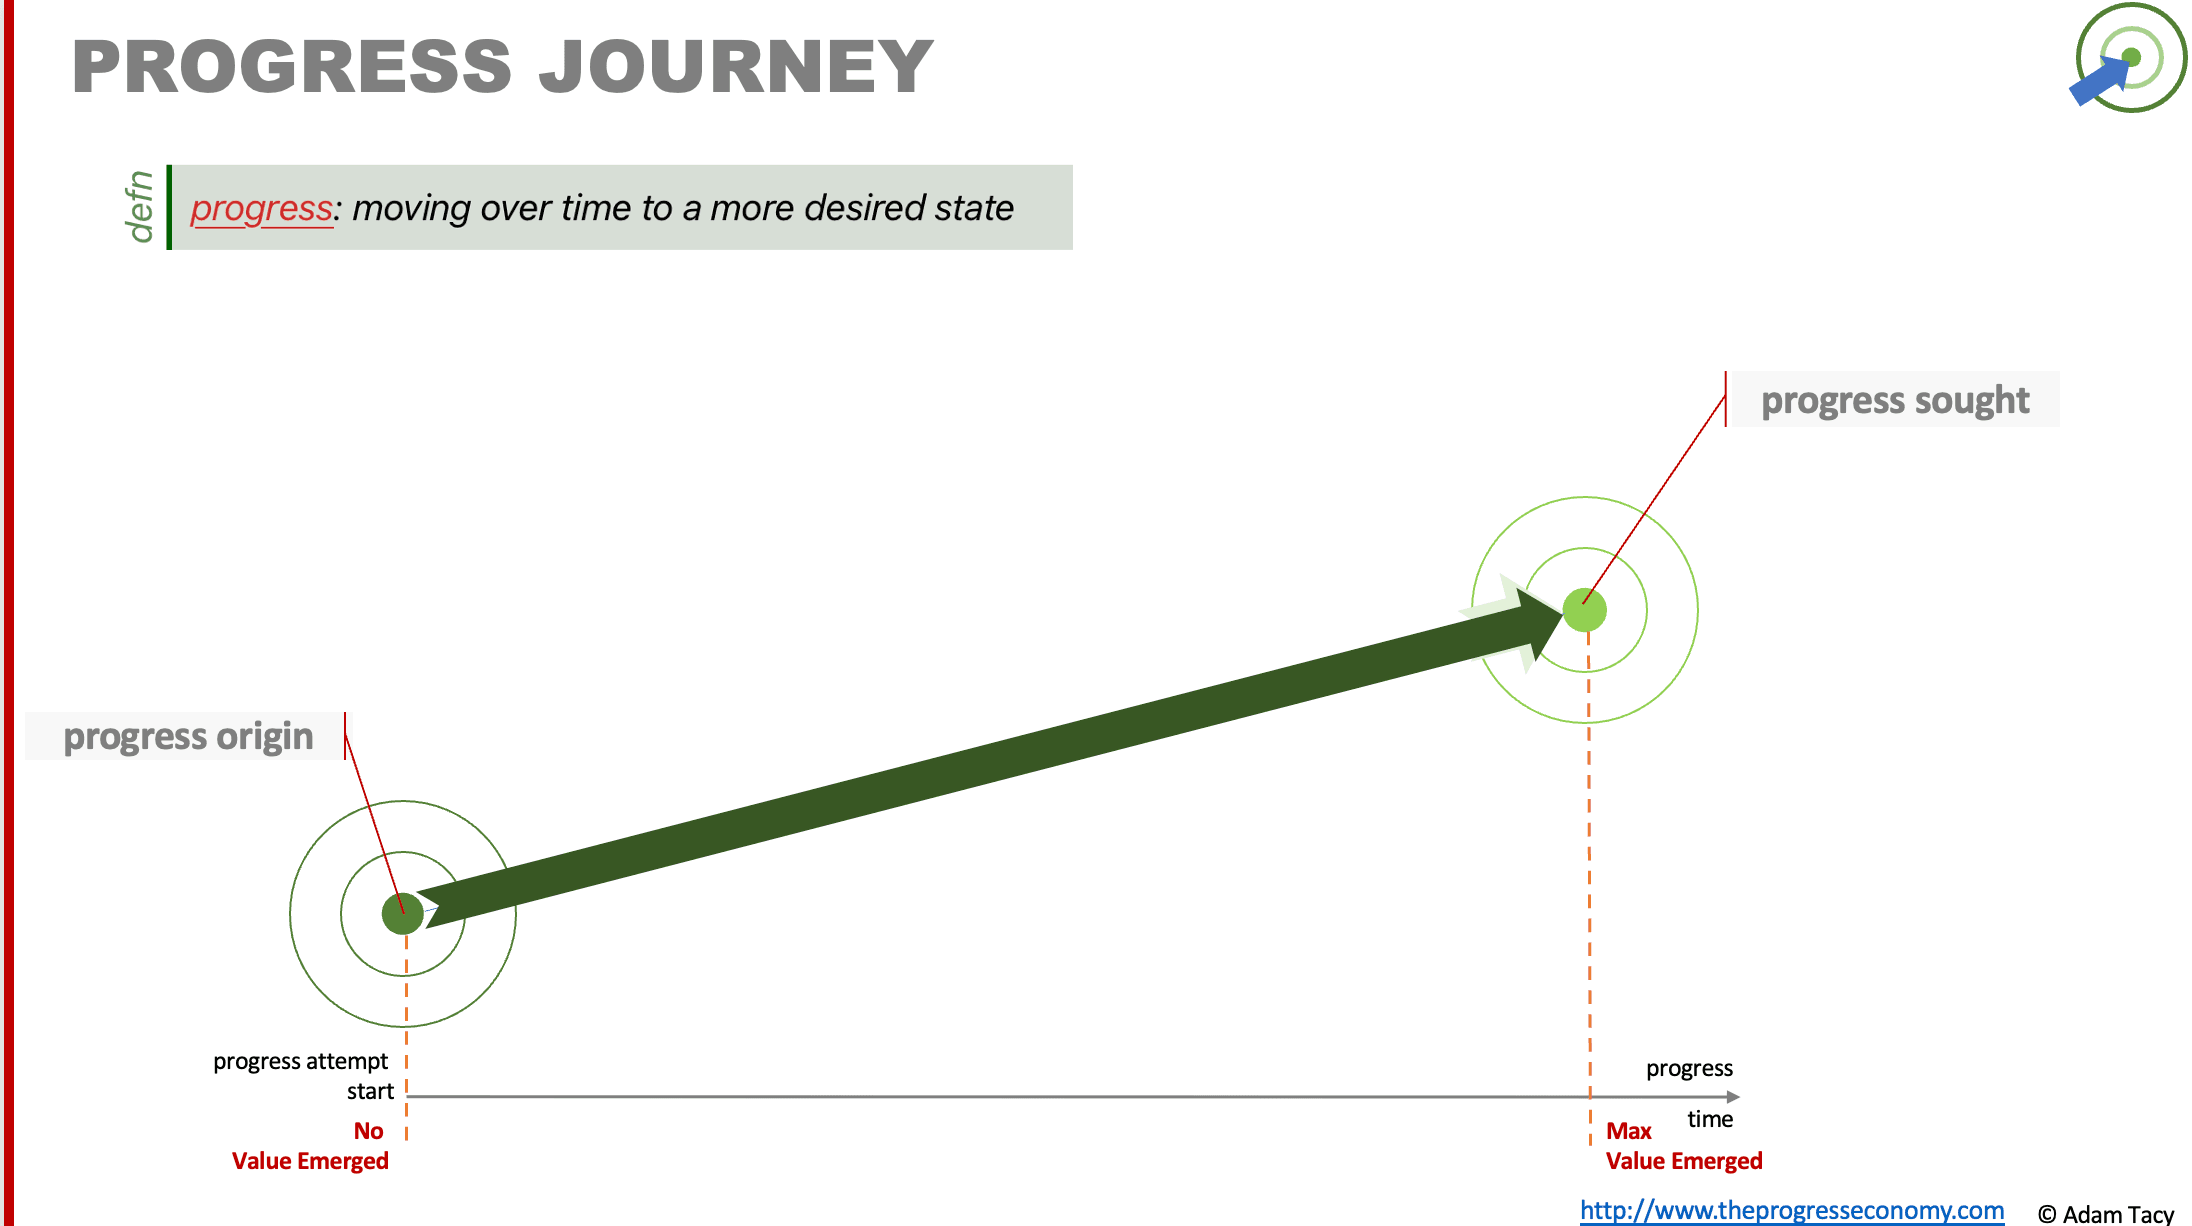
Progress is the movement, over time, toward a more desirable state – from progress origin to progress sought. This is the journey we visualise in the most basic form of the progress diagram, shown here:

On the diagram, progress sought is intuitively placed to the right and above progress origin to represent both movement and improvement.
We can say that the horizontal axis captures both progress and time, ie progress over time. We deliberately leave the vertical axis unlabelled, as doing so avoids unnecessary complexity in more complex diagrams.
Since, in the Progress Economy, we see value as context-specific progress comparisons we can also view it along the horizontal axis. In our example here we show emerged value – the Seeker’s comparisons of their progress reached and progress sought. At the origin, there is no progress reached, so the emerged value is zero. When they feel their progress reached equals their progress sought, they should also feel that maximum emerged value is achieved.
Exploring basic concepts
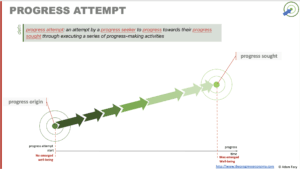
With the foundations of the progress diagram in place, we can use it to explore progress attempts – the set of progress-making activities performed to move from the Seeker’s progress origin towards their progress sought.
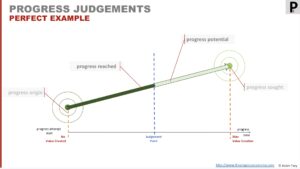
Understanding these attempts allows us to explore how a Seeker judges their progress, forming the basis of their progress judgements that they may ultimately interpret as value.
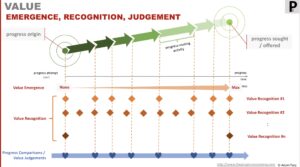
It also helps us explore when these judgements occur and how emerged value becomes meaningful value through the value recognition process.
From here, we can explore the foundational progress hurdle – the lack of capability. This provides the entry point to understanding progress propositions and how they offer to help Seekers make progress as a joint endeavour.
In most cases the progress offered by a proposition does not align with the progress sought by the Seeker. Nor does the proposition’s progress origin necessarily match the Seeker’s own starting point.
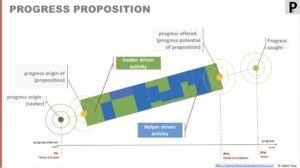
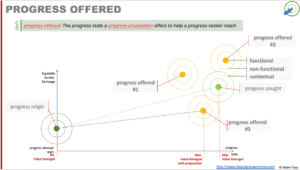
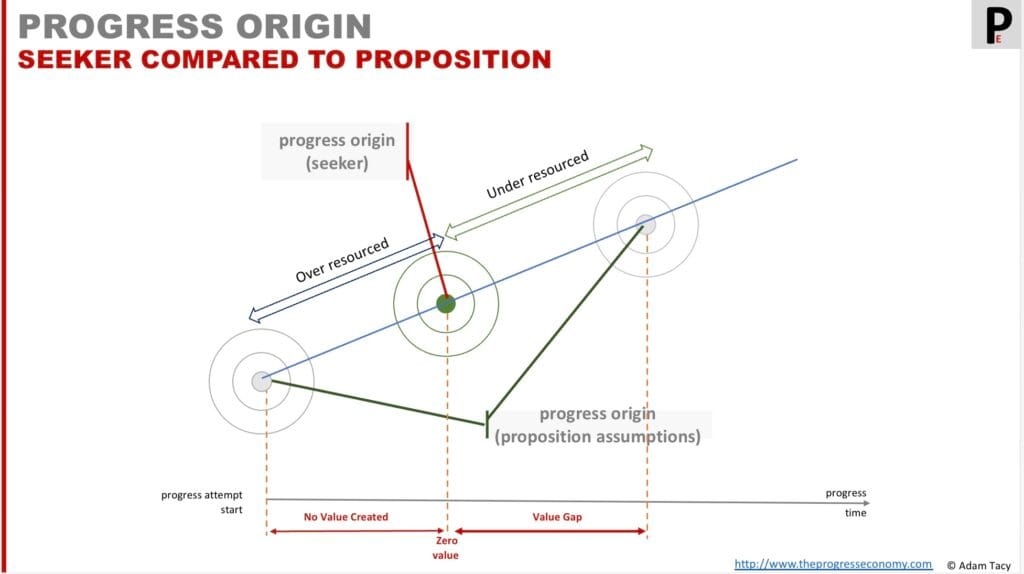
These mismatches are critical to understand. They shape both the Seeker’s decisions to engage, their experience, and the innovation opportunities.
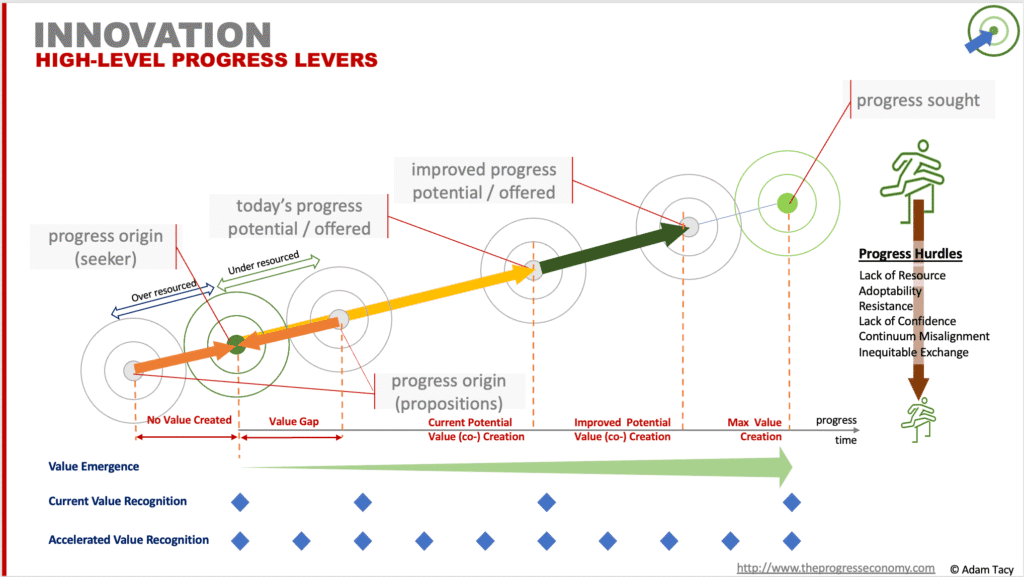
Revealing Innovation
In the progress economy, we see innovation as an activity to make better progress. The progress diagram allows us to explore that in detail, resulting in a number of progress levers you can leverage to make innovation more systematic and successful.
Discovering sales
The progress diagram also allows us to explore the concept of sales – it’s about aligning your proposition’s origin and progress offered with the Seeker’s origin and progress sought,

Sounds a lot like innovation, right? Indeed, in the progress economy, we see sales and innovation as two sides of the same coin.
Why this matters?
The progress diagram gives us a common, visual way, to explore the concepts of the progress economy, ultimately revealing to us the mechanisms of sales and innovation, and that they are two sides of the same coin.
It is a positioning tool, one that is very useful and successful when used that way (but beware the temptation to think too deeply into positioning propositions against journeys; it is not meant to be a precise activity).
Let’s progress together through discussion…